17 May 2024 Data Storytelling
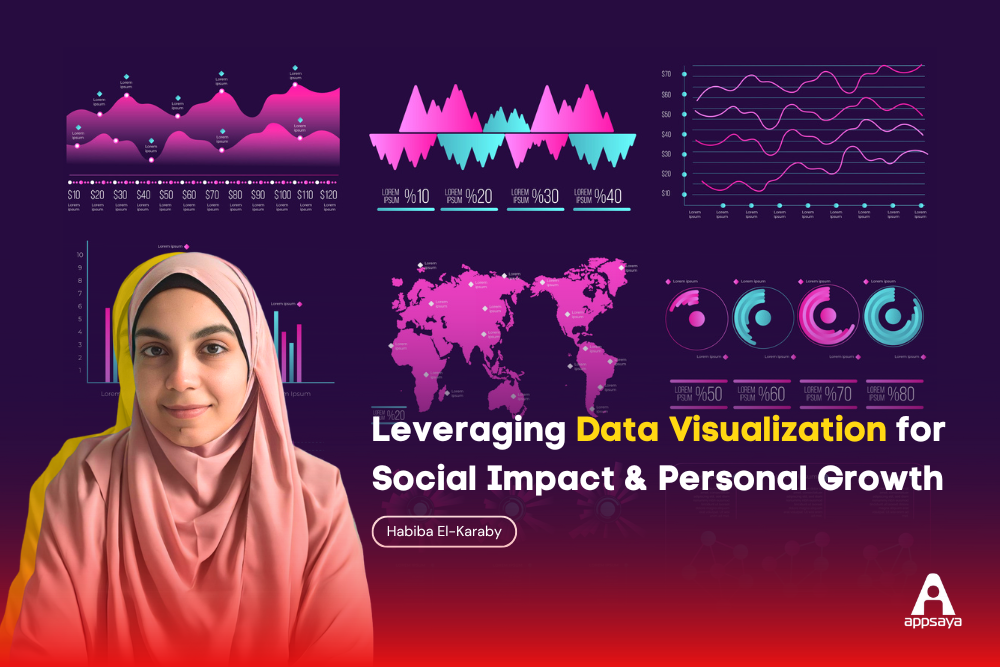
Leveraging Data Visualization for Social Impact & Personal Growth


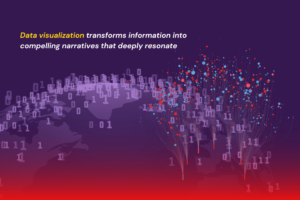
In a world overflowing with information and drowning in data, data visualization emerges as a powerful tool to craft compelling narratives that resonate deeply with audiences. From shedding light on pressing social and humanitarian issues to fostering personal growth and introspection, data visualization can be used as a catalyst for change. It drives empathy, action, and connection.
Spreading Awareness through Data Visualization:
Many like to present data visualization as an analogy to storytelling. The data used are the events of the story. The visual components draw the overall arc of the story from beginning to end. This element of creativity in data visualization is liberating. One can choose to shed light on any story by showcasing relevant datasets. Data visualization can be a tool for education and awareness. It illuminates the complexities of social issues that often remain obscured. It can also clarify topics that have long been plagued by misinformation. Whether it’s visualizing global poverty rates, illustrating income inequality disparities, or mapping environmental degradation, impactful visualizations have the remarkable ability to communicate the urgency and scale of humanitarian crises. They engage the audience in understanding the meaning behind facts.
Harnessing Data Visualization for Personal Expression:
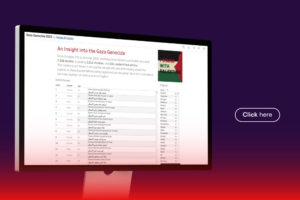
When creating visualizations, we choose how to tell the story. We become the narrators and the authors. We have the opportunity to let our personal values and interests shine through. I recently allowed myself to bring data analysis and visualization beyond my work obligations. I started to experiment with creating visualizations about the ongoing aggression in Gaza (check it out here). It empowered me to apply a technical skill I had only used for professional tasks in a new way: as a tool for self-expression and speaking up for my beliefs.
Fostering Self-Reflection and Growth:
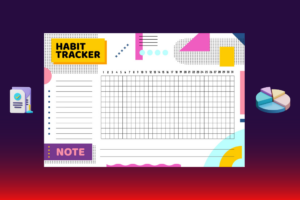
Beyond its role in societal discourse, data visualization can also offer individuals a unique space to articulate their personal narratives and experiences. Whether visualizing daily habits, tracking mood fluctuations, or setting and documenting personal goals, data visualization can be a tool for self-reflection. It enables individuals to gain deeper insights into their behaviors and aspirations. Data visualization can be a mirror through which individuals confront their strengths, weaknesses, and opportunities for development. Sharing personal stories through data visualizations can also build connections. Individuals not only find solidarity in shared experiences but also discover the power of storytelling in driving meaningful change and fostering a sense of belonging.
Conclusion:
Data visualization stands at the intersection of social impact and personal growth. It offers a transformative lens through which we perceive the world and ourselves. Data visualization is visual storytelling. We can use it to raise awareness, ignite change, and foster empathy.
I encourage you to reflect on how you can take the tools and skills you use in your professional life daily and stretch them beyond the realms of your career. Perhaps you will discover a meaningful connection between your professional and personal life that will strengthen your sense of purpose. This can bring about positive change in your life and the communities around you.
Thank you for exploring the transformative potential of data visualization with us. At Appsaya, we’re dedicated to helping businesses improve their data decision-making processes.
Reach out to us at hello@appsaya.com to discuss how we can tailor a data visualization solution to meet your needs. Let’s make every data point count for your business.
Author: Habiba El-Karaby, Data Scientist at Appsaya